LoL: UMAP and K-Means to Classify Characters — and why it’s useful

GitHub for the following article can be found here
As of today (October 2020) there are 151 “Champions” (playable characters) in the online game, League of Legends, each offering a unique and individual play-style that has made it the single most popular e-sports in the world. Although the variety provides for an engaging competitive environment, it creates complexity for both new players and analysts alike. If every Champion is unique, how is a new player expected to understand the intricacies of every match-up or an analyst meant to summarise the performance of a player?
In April 2016 Riot (the company behind the game) attempted to help this issue by introducing “Champion Classes”. This consisted of 12 sub-classes that fit into 6 classes. These were hand-crafted by the development team at Riot and provided a good starting point for new players to become accustomed to the game. You’re loading into one of your first few games and see a character called “Thresh”, a quick check would indicate his class is a “Catcher” and so is another character: “Blitzcrank”, who you’ve played against before. Although you miss some finer points, you understand the general idea is to avoid being caught by them.
However, these Classes quickly fell by the wayside and it is rare to find them mentioned in any content nowadays. This prompted me to answer a question: how would AI class each Champion? Would this agree with Riots interpretation, and if so what else can we learn about them? To do so, we will split the approach into four stages.
- Data gathering, cleaning and feature creation.
- Reduce the dimensionality of the data by extracting key signals.
- Use a clustering algorithm to split the Champions into classes.
- Analyse the Classes to determine trends & themes.
Pre-Note on Game Context (ignore if you’re familiar with the game):
If you are not familiar with League of Legends you will miss some context. If you’d like to become more familiar then you can read this introduction to the game. Otherwise, as a very minimum it will help to know it’s a 5v5 game where each team has a player in one of these roles: Top Laner, Middle Laner, Jungler, ADC, Support.
If you wish to apply a business spin to the article then translating “Champions” into “Customers” and data such as “Kills” and “Deaths” to “Purchases” and “Website Bounces” may help. You can jump to the bottom of the article to get some examples of it used in “the Real World”.
Data Gathering, Cleaning and Feature Creation
As usual, the first approach is to start up a Riot API session and start interrogating their extensive data lake. Note: I intend to create a full guide on how to do this, but in the meantime please see the GitHub for details. We first decide to limit the results to Diamond (near the top rank) players, as it provides a large pool of games that are considered relatively high quality. In total, we pull just over 68,000 games, where each row contains information on the Champion and a raft of key statistics from kills, deaths and assists to largest critical strike, inhibitors taken and dragons secured.
As well as the “standard” data points, we can also consider alternative features that could be extracted from the available data. For instance, it is possible to look at a dataset called “Timeline Events” and see detailed information about each kill. This includes the location, the time, the killers and the killed. From here, we can create two new features: Solo Kills: how many times in a game did the player get a kill unassisted & Early Roams: how many times in the first 10 minutes of a game did a player get a kill or assist in a lane that wasn’t their own.
Without elaborating too much on the monotonous, the data was cleaned, transformed and then aggregated to the point where each row contains the average statistic for a Champion in each role, where available. This means there is a separate row for Ekko in the Middle lane and the Jungle, both containing the relevant average for every statistic. The final features can be found below:
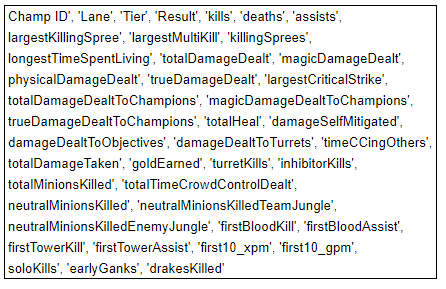
List of all statistics pulled for each game analysed.
Reduce the Dimensionality of the Data by extracting Key Signals
The issue we now have is that there is too much data to easily classify each Champion. Importantly, there is considerable multi-collinearity present in the data, where many columns are highly correlated. For instance, there is an obvious relation between the number of kills a Champion gets on average and the number of times that player goes on a killing streak, or how much damage they mitigate and how much damage they take.
Luckily, dimensionality reduction provides a reliable solution. Without labouring too much over this section, this technique takes all the known variables and attempts to “shrink” the data into fewer features. To help paint a mental picture, imagine you had only two variables: kills and gold earned. If you plotted these into a two dimensional space you would get something resembling the following:
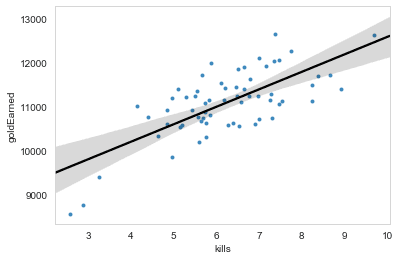
Now, note the line-of-best-fit running through the data. If you isolated it and turned it on its side you would have a single one-dimensional line! In essence, that 1D line is a combination of the effect of both variables. Left of the line is “poor and not killing anyone” and right is “rich and killing everyone”. Although you’ve lost granular data, you keep their essence in the single dimension. Although this is a gross oversimplification of what’s going on behind the scenes, that may help with your intuition.
As far as dimensionality reduction toolkits, there are three standard options:
- Principle Component Analysis (PCA)Uniform Manifold Approximation and Projection (UMAP)t-Distributed Stochastic Neighbor Embedding (t-SNE)
For this project, I decided to go with UMAP. I had two reasons for this: when experimenting with various combinations of techniques and parameters I found UMAP provided classes that were consistent with my intuition (yes, this makes it biased!); in my previous projects that used labelled data in which there is a right or wrong answer (think: cancer detection or digit recognition) UMAP provided better accuracy results than both t-SNE and PCA.
Applying this technique is so simple that it can be done in only three small lines of code. The only attribute worth playing with is the number of components the data will be reduced into.
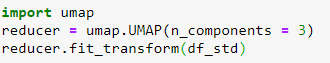
Python implementation of the UMAP package.
However, note that the data should be standardised before applying the UMAP transformation, for this use the SKLearn function StandardScaler on your dataframe. The GitHub can be seen for further information on this.
As a summary, this section has transformed the 39 original features into 5 core components. Each component “contains” the information from the original dataset but has been grouped based on their underlying relationships. If it helps your understanding, imagine that one component is called “Kills”, and although contains parts of all the features, it is most heavily related to variables that are correlated with kills (think: gold, kill streaks, high damage, etc..). Where did 5 come from you may ask? Experimentation and testing! It seemed to provide the most viable results (again, bias warning).
Use a Clustering Algorithm to split the Champions into Classes
We now have a 5-dimensional dataset for each Champion in each role, it’s time to try and classify them into four classes. Four is also relatively arbitrary, any number of classes could in fact be used. However, from experimentation I found when split into four the classes provided a good balance of simplicity and diversity. Although this again creates bias in the process, given we are dealing with Unsupervised Learning there is no “right” answer or a results based methods to optimise for. In practice, these decisions are ultimately left to those with the domain knowledge (or more often, based on a requirement).
To create these four classes we can use a technique known as **k-means clustering**. The technique looks to fit the data into clusters around a central point, where each data-point will be classed based on which of these centers they are nearest to. To do this, the algorithm starts by choosing four centroids at random and classifying each Champion based on whichever of these they are closest to. Once they have all been classified, it finds the centre of each of these newly assigned clusters, then uses these as the updated centroids. It continues like this until these central points stabilise.
Here’s a visualisation of the the algorithm to help:
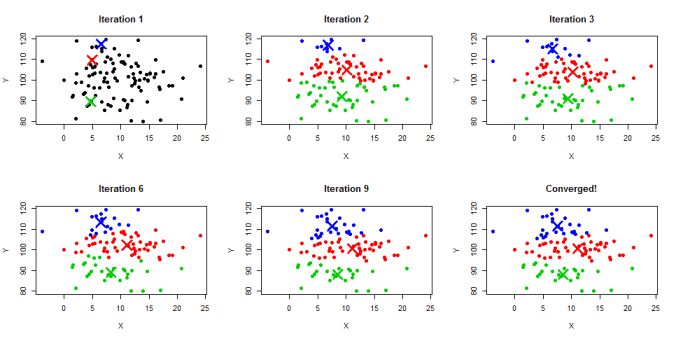
Visual example of the k-means algorithm, starting with three points at random then slowly moving towards a final centroid for each class.
Analyse the Classes to determine trends & themes
Once k-means has been run on the reduced data, we will now have all the Champions split into four individual clusters. Since we’re operating in a 5-dimensional space it is impossible to visualise the outputs to help with our understanding of these classes so instead we can aggregate all the original statistics based on the four classes. As a result, we’ll have a table containing the four classes and their averages for each of the features we took from the Riot data lake. Here’s an extract:
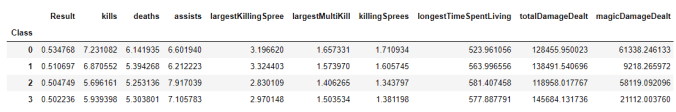
Table showing the average aggregate statistics for the four classes in the ADC role.
It’s now a case of studying these to get a better feel for how they differ from each other. To do this, I ran a script that compared the classes average on each statistic against the lanes average and then ordered them by their percentage difference.
For instance, in the Jungle I found a class that made the first kill in 18.23% of their games as opposed to 12.77% average for the role. This same class also cleared Jungle camps 6% less than the average. The sort of Champions that were classified to this cluster? Shaco, Lee Sin, Elise, Xin Zhao. This helped me paint a picture of a group, that I later labelled “3-Camp Gankers” in reference to a common Jungle path these Champions take where they do Red Buff, Blue Buff, Gromp and then immediately attack a lane or invade the enemies Jungle camps(thanks to jung.gg for the data on that one).
You can find a list of all the classes for every lane, a brief description, which meta Champions fit within them, as well as 3 key statistics where they over-perform the average and 3 where they under-perform here:
KEY POINT: It is critical that I make a point here that the Strengths and Weaknesses are provided to give a quick intuition of each class. It is common for individual Champions not to have all the same Strengths as the ones I’ve selected. The reason they still fall into the class is that on average across all the statistics they are closer aligned to that one than any other, but they will not necessarily be a perfect child of the class!
For example, the Champion Kassadin in the Middle Lane is classed as a Roamer who’s strength is that they often attack enemy lanes early in the game. Kassadin himself does not share this particular quality, but shares more of the remaining attributes with this class than he does with any other.
The So What?
As I often argue, AI for the sake of AI is wasted time. What are the benefits of segmenting Champions into classes? This is a most valid question and one that should always be posed when looking at any technique, approach or project. Here are a few (albeit exaggerated and fictional) examples that may help answer it (Warning: You may struggle to follow unless you are familiar with the game, if not — the third example is applied to a business problem):
You are an analyst of a leading European professional e-sports team. In an unprecedented turn of events the starting Middle laner of the opposing team dramatically fell and injured himself whilst walking on stage and has been replaced by a first-time rookie. It’s 10 seconds before Champion select and your Head Coach rushes over to you and says “What do I need to know about him?!”. There simply isn’t the time to starting listing his common Champions and solo-queue performance statistics. You need a one-liner to provide the coach with just enough information to give him the edge. Luckily, you already had the AI generated Champion Classes from earlier so you run a quick analysis of the players last 50 solo-queue games and say: “His most common and best performing Champion class is Safe Scalers!”. You’ve already briefed the coach on this, he knows what you mean. He target bans Azir and Corki then first picks Orianna. The guy chokes as he’s forced to either play a lower tier Safe Scaler or is forced out of his comfort zone on a Lane Bully where he gets caught out constantly and feeds.
This is an overly-sensualised example but carries an important message: A summary now is sometimes better than details later.
A quicker and (slightly) less dramatic example would be if you spent Season 10 dominating the Top lane as Maokai, only to read that in patch 10.22 he will be nerfed into oblivion having all his base stats reduced to -40. You enjoyed his play-style and want to find someone to replace him. You find that Maokai is considered an Enabler & Engager, just like Malphite and Ornn. Ornn currently rocks a 98% win rate so you decide he will be a good fit for your final weeks climb.
Message: Knowing how to broadly describe what you like helps you find what else you may like. In fact, I wrote an article that uses a similar technique for the exact purpose of Champion recommendations.
I will also provide a business example, as I think it’s important to appreciate “real world” uses of such techniques:
I will also provide a business example, as I think it’s important to appreciate “real world” uses of such techniques:
Imagine you are Head of Marketing at a Widget Company and you have recently been given a budget to create five marketing campaigns to send to your current customers. If you perform the same steps above but instead with data such as demographics, purchases and website interactions you can segment your customers into five “classes”. By studying these you will be able to tailor your campaigns to target a certain type of customer, increasing their effectiveness. For example, you may find one group of customers are “Heavy Researchers” with irregular purchases and a long time spent on the site before making a decision, often holding items in their basket for several weeks. On the flip side, you have “Spontaneous” customers who have clicked an Instagram link and checked out within 30 seconds. All customers in class one receive an email containing a detailed report about your latest product, the pros, cons and finer details. Class two gets an Instagram video of a cute dog playing with your product.
The message? Individual-level analysis is powerful, but often isn’t viable for the use-case. In this case, it’s OK to “throw away” some finer levels of detail in order to get the job done.