How useful is a Champion's Win Rate?
I have debated how best to approach this topic, not because it is complex by any means, but simply because it touches on a broader question. However, too long have these articles been sent without a single statistic to show! So, let’s fly through the master of the topic so we can get down and dirty in the numbers.
Statistics are incredibly abusable, or as Mark Twain put it:
“Facts are stubborn things, but statistics are pliable”
You can deliberately have numbers dance to your rhythm and express the story as you want it to be seen. This means it’s equally easy to fall for their mirage, incorrectly seeing them as a holy truth. Statistics should be seen as complex equipment, only useful in the hands of a trained professional, not a hammer to bash out an answer with.
In other words, it’s far too easy to misinterpret statistics. Without adequate context and a deep understanding of what they are showing you can easily be tricked into putting faith where you shouldn’t.
With that out of the way, let’s go through a specific example:
How do we evaluate the strength of a Champion?
Consider these (actual) win rates for a moment:
- Top Rumble: 46%
- Support Thresh: 50%
- Top Kayle: 67%
- Jungle Rammus: 56%
- Mid Qiyana: 45%
If you were a professional coach, how would you prioritise which Champion to pick in your next league game?
The correct answer is: you wouldn’t use this information at all. It is essentially useless without the context of where it comes from. Let’s break down each statistic, identify it’s flaw and suggest a remedy.
The Red/Blue Side Differential
An entirely underappreciated fact in League of Legends is that Champions can have entirely different win rates depending on which side of the map they play on. There are many reasons why this happens and I don’t claim to have the game knowled ge to cover this topic with sufficient detail.
So instead, let’s keep it simple and look at an isolated example of this effect: certain top lane Champions with limited mobility suffer far more when playing the more vulnerable Red side than they do on Blue (look at the map as to why). An example of one such low-mobility and vulnerable Champion is Rumble, who has a dismal 46% win rate on Red Side - but 51% on Blue. An incredible 5% differential by just flipping the map! On average, his win rate is 48.5% - a very ignorable pick.
A coach could have easily thrown out Top Rumble simply by gazing over this statistic and not adding the additional context of side strength. So, instead of viewing win rates as averages, how about instead we look at their win rates GIVEN the side we’ll be playing them on in our next game?
Situational
Most players understand the power of counter-picking, however too often do I see this limited to the lane. There is so much more to consider than just “do I counter my direct opponent”? This could be at the highest level, checking whether the pick fits the composition and playstyle of the team you are building, or more specific statistics like whether your support pairs well with your jungler.
For instance, Thresh support sits at the middest of win rates; 50%. However, by simply pairing it with a Jarvan Jungle it rises to 54%. This can be compounded with ADC Kalista (56%), Mid Anivia (55%) and Top Ornn (54%). We haven’t even considered the enemy composition at this point, but immediately this pick has risen from B to A+ Tier simply by judging it on its fit in the team, as opposed to some generic win rate.
How does a team remedy this? It’s actually one of the more complex factors, since there can be the pull and push effect of building a composition. Champion A may pair well with Champion B, who pairs well with Champion C. However, for whatever reason, Champion A and Champion C do not work together.
Without the use of more complex algorithmic approaches, a good place to start is by prioritising a player within your team and anchoring a decision around them. For instance, if your ADC tends to carry your games then give them the hot-pick of the current patch and find a support that works well with it. Once these two decisions have been “locked” it’s easier to flex the remaining three lanes around them, as opposed to trying to optimise an entire team composition at once.
Sample Sizes
Hopefully, most of you already appreciate this point, although I am continuously surprised by how ignorant some professionals can be on it and so we will mention it for completeness.
If a Champion (such as Top Kayle) has a 67% win rate in 3 games - it might as well read: “win rate between 0-100%”.
Here’s a quick thought experiment. In a world where all 162 Champions are perfectly balanced, if they all played 100 games how many would have over 60% win rate?
The answer: 4.6 Champions.
TA lot of people would see “60% win rate” and think, wow, this Champion is broken. Not realising that in 100 games we expect at least 4 Champions to be above this number by pure chance, entirely uncorrelated to their strength.
A common solution to this is to add ranges based on the sample size. If a Champion has won 67% of their 3 games, then that range is going to pretty big. If another had won 67% of 300,000 games - we can safely assume the actual strength is somewhere around that 67% mark.
The Stage Effect
One of the major problems when talking about statistics in esports is that there simply aren’t enough professional games played to form a robust view. Especially as patches constantly come and mess everything up. Therefore, it’s not uncommon for teams to use the statistics from solo queue as a proxy of potential professional performance.
However, this assumes a correlation between a Champions solo queue and stage win rate, which simply doesn’t exist consistently. For instance, Jungle Rammus currently has a 56% win rate - in Iron elo. Obviously, you wouldn’t actually use data from low-elo games, however the fact that there is such a considerable difference between a Champions win rate from low-elo to high-elo should be the warning sign that you may have just as much trouble comparing a Master+ game to a stage game, even though some of those Master+ players are on stage themselves!
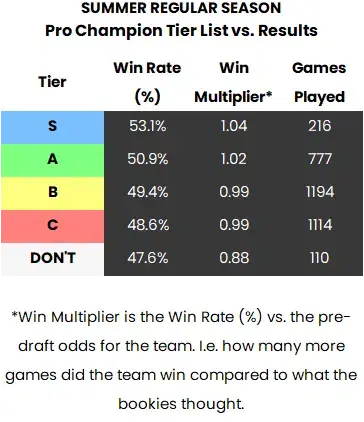
I’ve written about this extensively, and I even spent a season using solo queue statistics to predict how strong a Champion will perform on stage (with quite some success, see the results below; the Tier is my prediction and the Win Rate was the actual results). The trick is not to use solo queue win rates explicitly, but instead use their relative changes each patch to adjust existing stage-game performance. If this has perked your interest, you can read more about it here.
It’s a Player Difference
Another topic I will not stop talking about is the undeniable impact of a players skill on a Champion. More on that, here.
A more nuance effect is how this varies per Champion. For instance, Qiyana played in the middle lane has a sub-45% win rate IF that person has never played Qiyana before, rising to 55%+ once the player has mastered her complex kit. Compare that to Malzahar, where players first timing only suffer a measly 1% drop to the average player.
This is a simple effect, but also consider the added complexity on win rates given the distribution of players on the Champion. Lee Sin, for instance, is a hard-to-master Champion that is played religiously throughout all elos and therefore the average win-rate is made up of a combination of varying skill-levels. Yorick, however, is far less popular and tends to be played by those obnoxious One-Trick Players, hence his average win rate is more heavily weighed towards what an experienced player can do with him.
This also has an impact on win rates from stage games (if you’re willing to ignore the sample size problem for now). Some players have signature picks and their individual performance becomes a significant contributor to that Champion’s win rate. For instance, Olaf top has been played 20 times this season; 10 of which have been either BrokenBlade (G2) or Adam (BDS). The win rate is far more dependent on those two players, and the strength of their respective teams, than anything to do the underlying power of the Champion itself!
This is not as simple to unpick as some of the others, however a good approach as a coach is to have the statistical ratings of the complexity of a Champion on-hand. When deciding on potential Champions for a player, compare their comfort levels to the complexity. If it’s a 10 on complexity and a 1 on comfort, be aware that the quoted “50% win rate” might actually look more like a 45%. On the other hand a 1 complexity & 10 comfort means you should adjust down your expectation on how impactful their experience will be; that 50% might be a 50% after all.
To Conclude
These are just 5 examples of what may be effecting the headline number of a Champions’ win rate. I certainly have not covered them all, and even within each of these there exists a number of additional sub-caveats to consider.
However, at each additional component we are bringing ourselves closer to the “real” answer. Somewhere in the statistics lies that holy truth, we just need to work a lot harder to get there (and average win rates alone are dog-water useless so please stop using them!).