LoL: Analyzing “Tilt” to Win More Games
Is tilt measurable? Does playing after a loss impact your win rate? How about a win? We explore all this, plus the variance across Elos, in todays article.

Photo by Pixabay from Pexels
Previously I wrote an article on how we can use graph networks to help provide Champion recommendations in the game League of Legends (LoL). The technique is known as “User-user collaborative filtering”, where we utilise the information we know about a person to find similar users and then base our recommendation on what we know they like.
To help illustrate this, we’ll use the classic Amazon example. Imagine that you have added a PS4 and the latest FIFA game to your Amazon basket, the algorithm looks at all users who have previously bought a PS4 and FIFA together and then finds which other items they tend to have in their basket, i.e. the latest NFL game, Madden, which is then recommended to you.
Today, we’re looking at a different form of recommendation algorithm known as a “Content Based Model”. This technique instead looks to connect items together based on their similarities, i.e. if you’re buying a PS4 sports game produced by EA then here are some other PS4 sports games produced by EA. This technique is favourable when you have no information about user preference, such as when just launching the product.
However, there are almost 150 LoL Champions and we don’t want to spend all our time labeling them with all the various attributes we would need to make this work. So instead, what we are going to do is “describe” the Champions using their in-game statistics, such as their average kills per game or how much objective damage they do.
To do this, we can analyse 150,000 Diamond games. Note that I’ve limited this to Top, Middle and ADC players only given the inherent difference support and junglers have in their statistics (i.e. low gold from minions).
After averaging the data for all Champions the first thing to note is that there are some very distinct correlations between many of the statistics. It shouldn’t be a surprise that attributes such as “killingSprees” and “kills” are almost perfectly correlated (the former indicating how many times a player has been on a killing spree, the latter is how many kills in total that game). In statistics, this is known as "multicollinearity": multiple data points having a linear correlation.
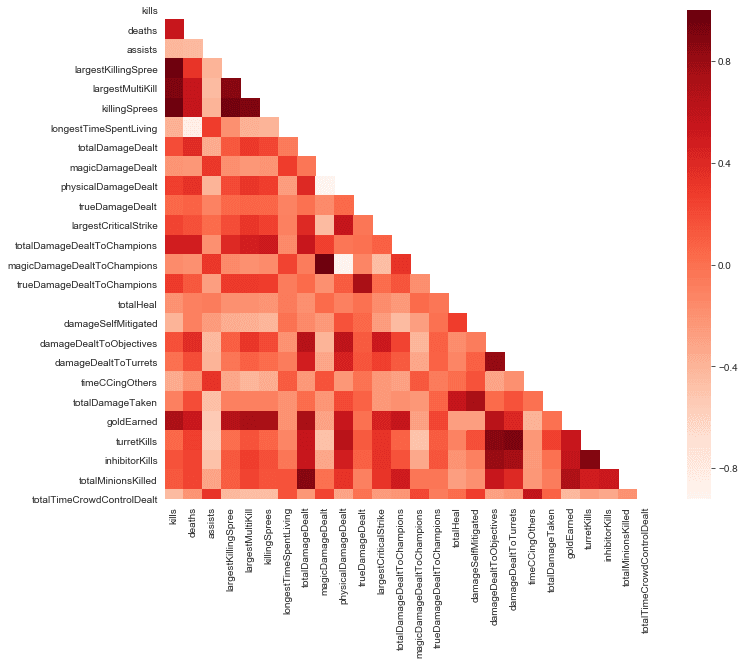
Graph illustrating the multicollinearity issue that occurs with such a large number of attributes.
A common approach to deal with this level of multicollinearity is either exclusion (pick kills, delete killingSprees) or aggregation (kills \* killingSprees). However, there is a better solution known as Principle Component Analysis (PCA) which is able to extract the core relationship between these attributes without manual intervention or the removal of potential key drivers.
PCA is a fairly complex subject that requires an understanding of Eigenvectors/values and there are plenty of great articles on it so I won’t labour the subject here. Instead, I will say that what PCA is trying to do is capture as much of the variance in the data as possible, whilst minimising the amount of variables used. These condensed variables are known as the Principal Components.
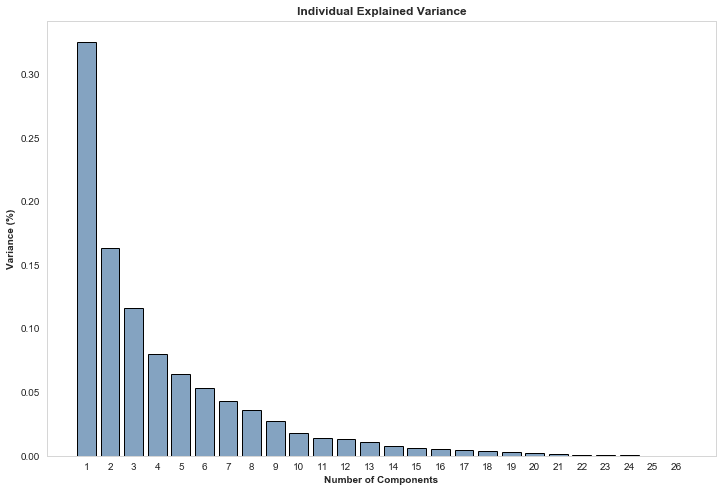
The percentage of variance each component explains of the original data, summing to 100%.
After fitting PCA to the dataset, we find that well over 30% of the variance of the data can be fit inside a single component, just over 16% is then found in the second component, 11% or so in the third and so on..
But what are these components? To help understand what they are made of and where they have come from, take a look at the graph below illustrating which variables are part of the first component. It’s clear that goldEarned is the largest contributor to this component, alongside objective damage, the largest multi-kill achieved, the number of killing sprees, damage dealt and total kills. It’s safe to say that this component is capturing the variables relating to gaining gold. If we add on the fact that “physical” damage is specified, you could start to imagine a Champion like Fiora or Tryndamere may have a high amount of this component.
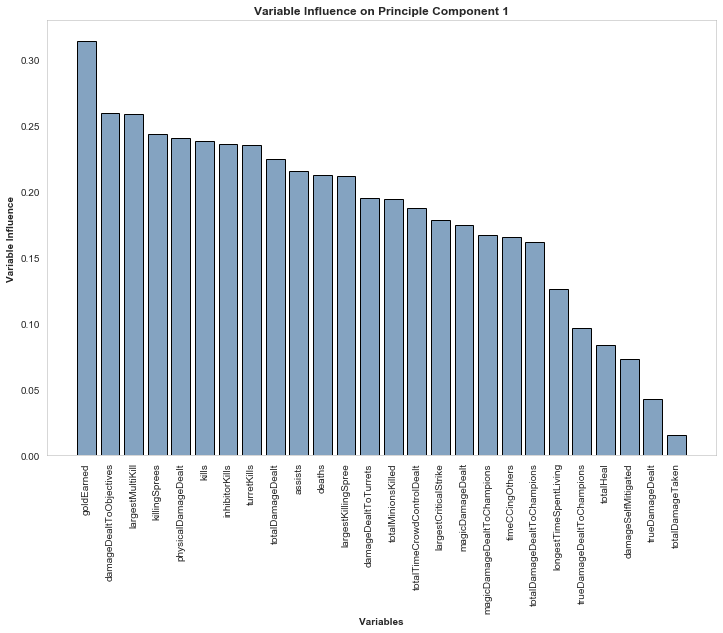
Graph illustrating which of the original variables are most highly correlated with the first component.
The 2nd component compromises of two main attributes: towers taken and damage self-mitigated (blocked/parried/immune/reduced etc..). However, you may be thinking how this all relates to content based recommendation models! Well, what we now have are two components that contain over 50% of the variance between the Champions. These can be considered as proxies for descriptions, where instead of “sports game” we have “Champion who kills everyone” and “produced by EA” becomes “high turret damage”! We can then plot these descriptive components out in a 2D space and we can start to see how it all comes together (sorry, formatting didn't come out very well when transferring from the old blog to iTero! Right click to Save Image for a closer inspection):
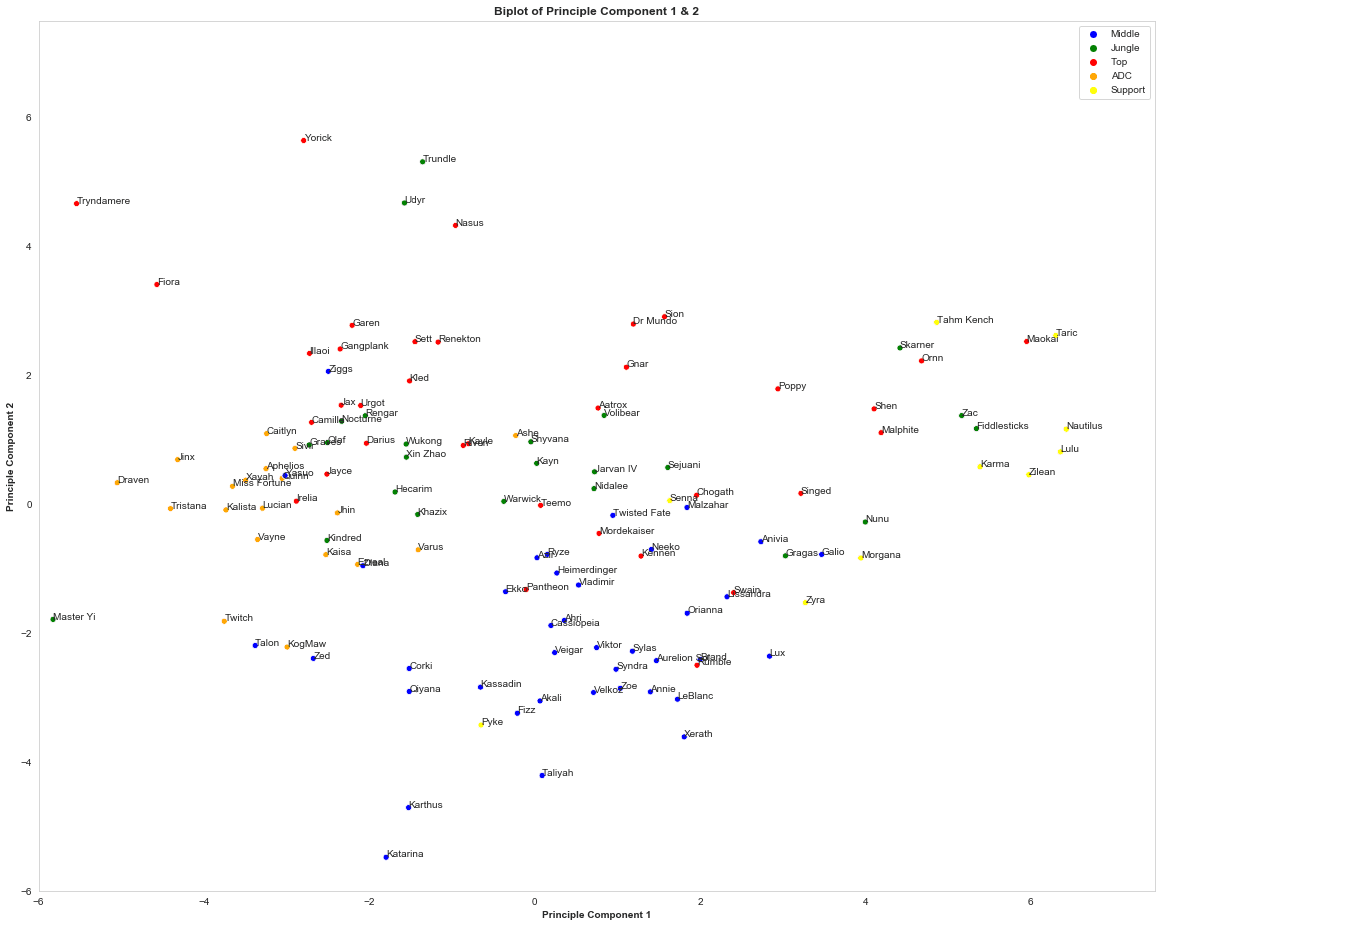
2D representation of the first two components, which can be used as the base for a recommendation engine. Champions are coloured depending on their main role, but the data is not necessarily gathered from players in that position.
Note: Although “Support” champions are shown here in yellow, the data is actually derived from farming lanes only. I.e. the Zilean data you see above is from when the Champion is played in either Top, Mid or as the APC.
Those of you paying attention will note that component 1 is inversed, where high damage/kills is scored low on the X-axis. Component 2 is not inversed, so a high number on the Y-axis indicates lots of turret taking and damage mitigation. To make sure it’s worked as expected, take a look at the Champions in the top left (i.e. that do lots of physical damage, take towers and mitigate damage); Fiora & Tryndamere (Trynd’s ult counts as damage mitigation). How about the bottom center where we see Katarina and Karthus who score relatively high on damage and kills but aren’t smashing turrets and mitigating damage. Sounds right to me.
The next step is simple, the recommendation is based on the Champion with the shortest Euclidean distance (straight line) from the Champion they currently play. You play a lot of Taric? Try Maokai. Akali? How about Fizz. Unkillable Dr. Mundo? You’ll love our boy Sion.
If we wanted to expand on this, we’d move to higher dimensions. If you go back to the graph showing how much variance is captured in each component, I’d say there’s an argument to build the model based on 3, maybe even 5 dimensions. The rest works the same, but given the visualisation becomes tricky we’ll leave it there for now!
I hope this provides another insight into potential recommendation types that may be worth exploring and the benefits PCA provides, although I use League of Legends as my domain these can easily be applied to any other field. I recommend going back up to the large graph, find your main and seeing whether you’d agree that the ones surrounding it are a similar play-style.
Here are some other articles that may be of interest.
Is tilt measurable? Does playing after a loss impact your win rate? How about a win? We explore all this, plus the variance across Elos, in todays article.
Measuring the similarities of Champions in a graph network, and how certain players consistently enjoy the same sort of Champions across all roles.
Comparing and ranking the most popular apps for League of Legends.